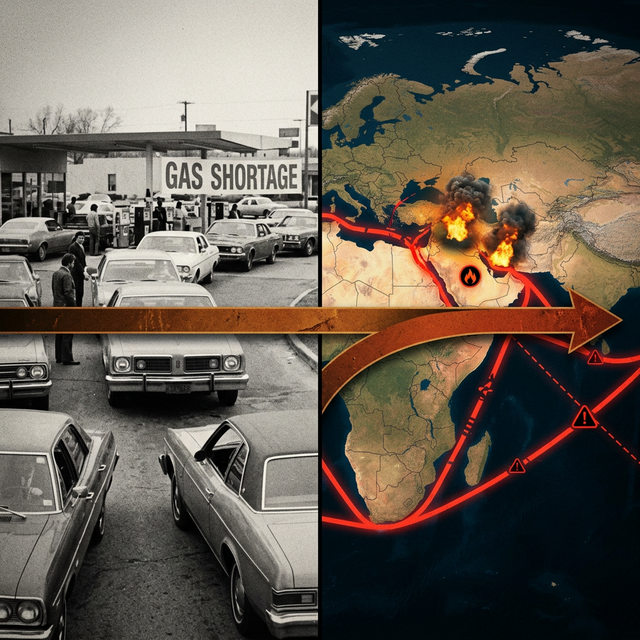
How Bad Could It Get? Comparing the 2026 Gulf Crisis to the 1970s Oil Embargo — Three Times the Scale
Every generation has its oil crisis. 1973. 1979. 1990. 2022 (the Russian gas cut). Each one reshaped the global economy for years — sometimes decades.
The question every serious economist is now asking about March 2026 is direct and uncomfortable: How bad could this one get?
The honest answer, based on structural analysis comparing the 2026 Hormuz crisis to historical precedents, is deeply unsettling. If the disruption runs beyond 60 days, we may be looking at an event three times the economic scale of the 1973 Arab oil embargo.
[!WARNING] The 1973 oil embargo produced: a 400% increase in oil prices over 6 months, double-digit inflation in the U.S. and Europe, a 40% decline in U.S. GDP growth, and a recession that lasted through 1975. The 2026 scenario involves more oil volume, more globally integrated supply chains, more debt-laden governments, and a more fragile post-COVID economic baseline.
Advertisement
The 1973 Embargo vs. 2026 Hormuz: By the Numbers
| Dimension | 1973 Arab Oil Embargo | 2026 Hormuz Crisis |
|---|---|---|
| Daily oil withheld | ~5 million barrels/day | 20–21 million barrels/day |
| Share of global supply | ~7% | ~20–21% |
| Duration (initial) | 6 months | Unknown (days so far) |
| Global oil price move | +400% over 6 months | +12% in 24 hours (ongoing) |
| LNG market exposure | Minimal (LNG barely existed) | Massive (LNG is now 15% of global gas supply) |
| Supply chain globalization | Low | Extreme (just-in-time globally integrated) |
| Government debt/GDP ratios | Low–moderate | Historically high across G7 |
| SPR buffer capacity | None (just created post-1973) | Partially depleted |
The volume of oil at risk is four times larger than 1973. The integration of global supply chains — with just-in-time inventory and minimal safety stock — means the transmission from oil disruption to consumer goods shortage is dramatically faster.
The LNG Dimension: The Crisis Within the Crisis
In 1973, LNG barely existed as a commercial product. In 2026, liquefied natural gas is the backbone of European electricity generation — a legacy of the post-2022 pivot away from Russian pipeline gas.
European LNG import infrastructure has been built at record speed since 2022: 14 new floating LNG import terminals were commissioned in 18 months. These terminals take supply from Qatar, the United States, Australia, and Nigeria — with a significant portion transiting or originating in the Gulf region.
A prolonged Hormuz closure would:
- Cut Qatari LNG exports — Qatar is the world's third-largest LNG exporter
- Force rerouting of American LNG tankers through longer, more expensive routes
- Drive European natural gas spot prices toward 2022 record highs — which averaged €150–200/MWh for extended periods
At €200/MWh gas, European industrial manufacturing becomes economically impossible for energy-intensive industries including aluminum smelting, chemical production, glass, and ceramics. These industries were already running on thin margins after the 2022 energy crisis.
The Debt Amplifier
Perhaps the most underappreciated dimension of the 2026 scenario is the government debt context.
In 1973, the G7 nations had average debt-to-GDP ratios of approximately 35–45%. When oil inflation hit, governments had fiscal space to absorb shocks, provide emergency subsidies, and stabilize demand without immediately triggering debt crises.
In 2026:
- United States: 126% debt-to-GDP
- Japan: 260% debt-to-GDP
- Italy: 148% debt-to-GDP
- France: 113% debt-to-GDP
- UK: 101% debt-to-GDP
When oil spikes inflation, governments currently face an excruciating choice: absorb the cost through deficit spending (worsening already critical debt trajectories) or pass the cost to consumers (worsening recession risk). There is no good version of this choice when debt is already at these levels.
Oil at Triple Digits: The Non-Linear Threshold
The critical number in virtually every economic model of this crisis is $100/barrel oil.
Below $100: The economy bends, does not break. Recession risk is elevated but not certain. Recovery is feasible within 6–12 months of oil stabilization.
Above $100, sustained for 90+ days: Non-linear effects kick in. Airline capacity collapses as hedges expire. Manufacturing order books are suspended pending cost clarity. Consumer confidence breaks psychologically. Recession becomes the base case within 6 months.
At $130+ oil (the full-escalation scenario): The 1970s comparison becomes inadequate. Modern supply chains are far more oil-dependent and far less resilient than 1970s supply chains, which had more domestic production, more safety stock, and less global integration.
The Recovery Curve: How Long Does It Take?
Based on historical oil shock analysis:
- The 1973 oil embargo saw oil prices begin to fall 8 months after the embargo ended (prices were "sticky" downward due to OPEC coordination).
- The 2022 Russia energy crisis saw European gas prices normalize over 18 months after the initial shock.
For 2026, economic models suggest:
- Oil stabilization (assuming ceasefire): 4–8 weeks post-ceasefire
- CPI impact peak: 3–5 months post-disruption (inflation lags oil)
- Supply chain normalization: 6–12 months (shipping contract re-booking, inventory rebuild)
- Interest rate environment normalization: 12–18 months (Fed credibility and inflation expectations reset slowly)
This means that a conflict that resolves in April 2026 still has economic resonance through late 2027.
The Constructive Scenario: Why It Might Still Be Contained
Not every analysis is pure doom. The constructive case rests on:
-
U.S. and Saudi Arabia back-channel diplomacy: The U.S. and Saudi Arabia have strong shared interest in oil price stability. At $120+ oil, the political cost to the U.S. administration becomes electorally significant. Back-channel pressure is almost certainly active.
-
Iran's economic leverage: Iran needs oil revenue to function. A prolonged Hormuz closure hurts Iran as much as its adversaries. The leverage is a threat mechanism, not a sustainable strategy.
-
Technology energy transition resilience: In 2026, renewable energy provides approximately 30–40% of U.S. electricity. The U.S. economy is meaningfully less oil-dependent per unit of GDP than in 1973. The shock absorption is better than the historical comparison suggests.
-
Market efficiency: The $5,400 gold price and current defense stock premiums suggest markets have already priced significant tail risks. If the crisis de-escalates modestly, there is substantial room for a relief rally.
The 1970s comparison looms large. Whether 2026 validates it or narrowly avoids it will depend on the decisions made in the next two weeks.